Spreadsheet Editor
The Spreadsheet Editor is the shared table component used throughout ARD for entering and editing tabular data — gear ratios, map lookup tables, pickup point coordinates, ride height arrays, and more. It supports Excel-style copy/paste, keyboard navigation, undo, context menus, and unit conversion.
Overview
Wherever ARD needs you to enter a table of values, the Spreadsheet Editor provides a consistent interface. You'll encounter it in:
- Data Types — 1D Map and 2D Map editors for parameters like spring rates, damper curves, and tyre radii
- Kinematics — Pickup point coordinate tables (X, Y, Z per point)
- Gears — Gear ratios, shift points, inertias, and timing parameters
- Aerodynamics — Ride height maps for aero coefficients
The editor behaves like a lightweight spreadsheet — if you're familiar with Excel or Google Sheets, you'll feel at home.
Entering Data
Typing Values
Click a cell to select it, then start typing to enter a value. Press Enter to confirm and move to the cell below. Double-click a cell to edit its current value without clearing it.
Cell Selection
| Action | Behaviour |
|---|---|
| Click | Select a single cell |
| Click and drag | Select a rectangular range of cells |
| Double-click | Enter edit mode for that cell |
| Enter | Confirm edit and move selection down one row |
Selected cells are highlighted in blue.
Copy, Paste, and Undo
The spreadsheet supports clipboard operations for efficient data entry, especially when transferring data from external tools.
| Shortcut | Action |
|---|---|
| Ctrl+C (Cmd+C) | Copy selected cells to clipboard |
| Ctrl+V (Cmd+V) | Paste from clipboard into selected area |
| Ctrl+Z (Cmd+Z) | Undo the last change (up to 10 steps) |
| Delete or Backspace | Clear selected cells |
Pasting from Excel or Google Sheets
The editor recognises data pasted from Excel, Google Sheets, and other spreadsheet applications. It handles:
- Tab-separated values — Standard clipboard format from spreadsheet apps
- HTML table data — Rich clipboard format from Excel with formatting hints
- CSV data — Comma-separated values
- Multi-row, multi-column pastes — The pasted data fills from the selected cell downward and to the right
When pasting, the spreadsheet automatically expands to fit the pasted data if needed — new rows (and columns in 2D mode) are added as required.
Paste Workflow
Select the top-left cell where you want the data to start, then paste. The editor fills the rest automatically.
Value Parsing
When pasting, the editor intelligently parses different value formats:
- Numbers — Standard decimals and scientific notation (e.g.,
1.5e-3) - Percentages — Converted to decimals (e.g.,
85%→0.85) - Thousand separators — Commas are stripped (e.g.,
1,500→1500) - Empty cells — Preserved as empty
Context Menu
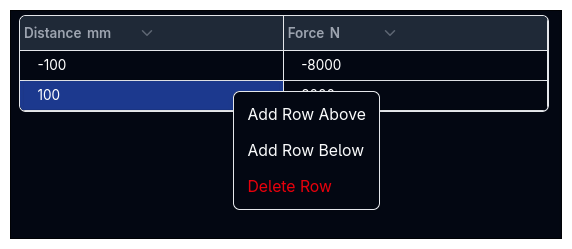
Right-click on any cell or row number to open the context menu:
| Action | Description |
|---|---|
| Add Row Above | Insert an empty row above the clicked row |
| Add Row Below | Insert an empty row below the clicked row |
| Delete Row | Remove the clicked row (disabled if only one row remains) |
In 2D Map mode, the context menu also includes:
| Action | Description |
|---|---|
| Add Column | Insert a new column after the clicked column |
| Remove Column | Remove the clicked column (disabled if only one data column remains) |
Units
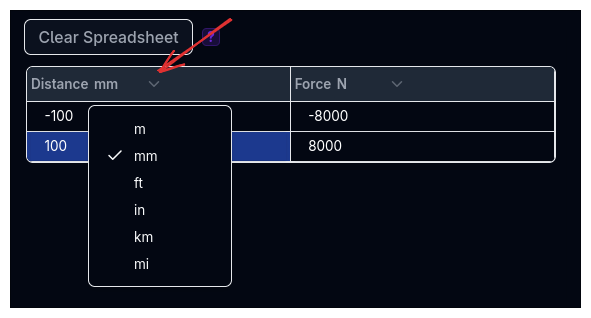
Each column has a unit dropdown in its header. Click the unit to change it — the editor converts all values in that column to the new unit automatically.
For example, changing a spring rate column from N/mm to lbf/in converts every value in the column.
Row Numbers
By default, row numbers are shown on the left side of the table. Some specialised spreadsheets (such as pickup point tables or ride height maps) hide row numbers to save space.
Edit Tracking
When you modify any value in the spreadsheet, the table border turns yellow to indicate unsaved changes. This matches the edit tracking used across all ARD input fields — see Data Types for more details.
Spreadsheet Variants
While the core editing behaviour is the same everywhere, the spreadsheet appears in several contexts with slightly different layouts.
1D Map Editor
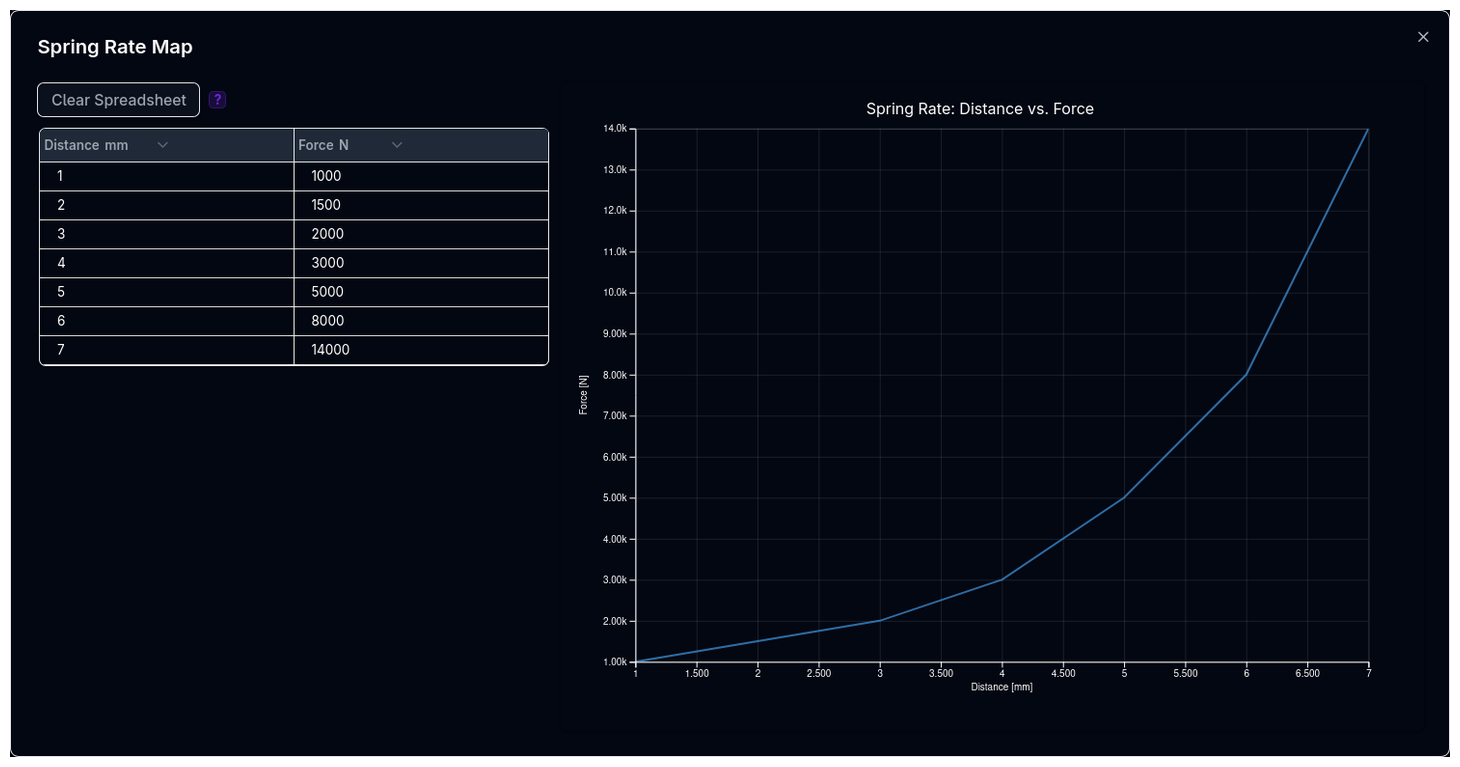
Used for parameters that vary with one input (e.g., spring rate vs. displacement, damper force vs. velocity).
- Two columns — X input and Y output
- Live line chart on the right updates as you edit
- X-axis ordering validation — Rows are highlighted in red if X values are not strictly increasing, with an Auto-sort button to fix the order
Opens as a dialog from a mini line plot thumbnail. See 1D Map for details.
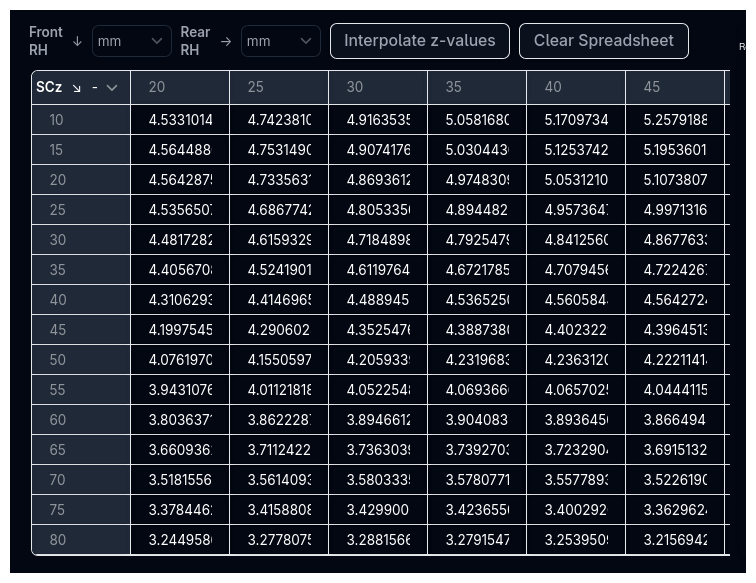
2D Map Editor
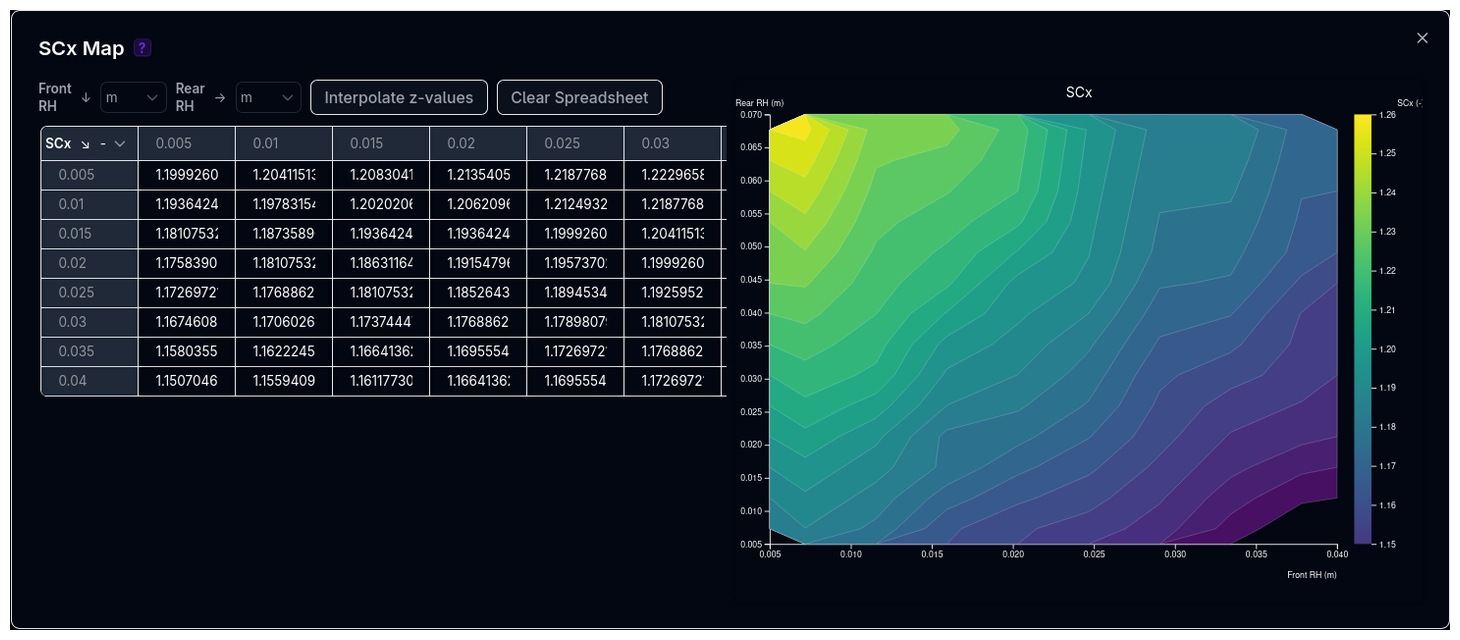
Used for parameters that vary with two inputs (e.g., loaded radius vs. speed and load, aero coefficients vs. front and rear ride height).
- Grid layout — Column headers are one axis, row labels are the other, cells contain the output values
- Live heatmap on the right updates as you edit
- Add/remove columns via the context menu
- Interpolate z-values button fills missing cells using bilinear interpolation from surrounding values
- Clear Spreadsheet resets to a single cell
Opens as a dialog from a mini heatmap thumbnail. See 2D Map for details.
Ride Height Map Editor
Used for aerodynamic ride height sensitivity maps. Two columns represent front and rear ride heights, with a visualisation on the right showing the ride height envelope.
Gear Map
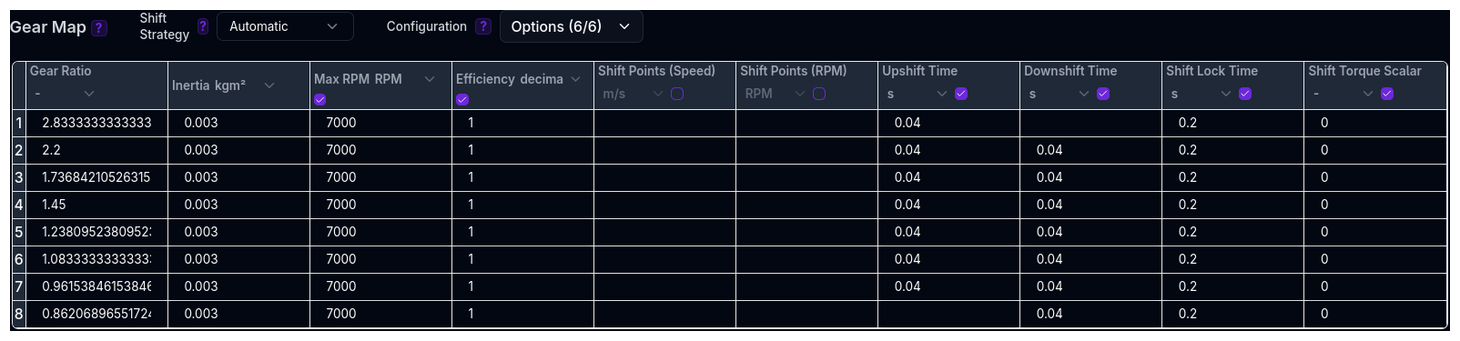
The Gears page uses a wide spreadsheet with up to 10 columns — gear ratios, inertias, max RPM, efficiency, shift points, shift times, and torque reduction. Columns can be toggled on and off using the Configuration dropdown, and disabled columns appear dimmed.
Pickup Points Table
The Kinematics page uses a four-column spreadsheet (Labels, X, Y, Z) for suspension pickup point coordinates. The label column is locked (not editable) and shows the point name, while the coordinate columns are editable.
Optional Columns
Some spreadsheets have optional columns — columns that can be enabled or disabled with a checkbox in the header. When disabled, the column is dimmed and its cells cannot be edited. This is used in the Gear Map to toggle features like per-gear max RPM or transmission efficiency.
Locked Columns
Columns can be locked (indicated by a lock icon in the header). Locked columns display data but cannot be edited. This is used for computed values or fixed labels, such as pickup point names in the Kinematics table.
Tips & Best Practices
Paste Large Datasets
For tables with many rows, prepare your data in Excel or Google Sheets and paste it in. This is faster and less error-prone than typing values one by one.
Use Undo Freely
Ctrl+Z works reliably for up to 10 steps. If a paste goes wrong or you accidentally delete data, undo immediately.
Check X-Axis Ordering
For 1D Maps, the X-axis column must be strictly increasing. If the editor highlights rows in red, click Auto-sort to fix the order automatically.
Interpolate 2D Maps
When entering a 2D Map, fill in the boundary values first (edges and corners), then use Interpolate z-values to fill the interior. Adjust individual cells afterwards if needed.
Related Topics
- Data Types — How Value, 1D Map, 2D Map, and Expression modes work
- Gears — Gear map spreadsheet with optional columns
- Kinematics — Pickup point coordinate tables
- Aerodynamics — Ride height map editors