Vehicle Compare
The Vehicle Compare view lets you inspect and compare the full vehicle configuration behind one or more simulation results. It shows every setup parameter — springs, dampers, aero maps, pickup points, and more — side by side, highlighting exactly what differs between configurations.
Overview
Every simulation result in ARD stores the complete vehicle setup that was used when it was run. The Vehicle Compare view reads those stored setups and presents them in a structured, searchable table. It operates in two modes:
| Mode | Trigger | Behaviour |
|---|---|---|
| Vehicle Summary | Select one result and click the view button | Shows all fields for that result's vehicle configuration |
| Result Comparison | Select two or more results and click the compare button | Shows only the fields that differ between the selected results |
In comparison mode, an optional reference result can be set so that differences are highlighted relative to a single baseline configuration.
How Racing Teams Use It
- Setup auditing — Select a single result to review its full vehicle configuration and verify all parameters are correct before a session
- Change tracking — Compare two results to see exactly which parameters were changed between runs, ensuring only the intended modifications were made
- Regression analysis — After a performance regression, compare the current setup against a known-good baseline to find unintended changes
- Setup documentation — Export the comparison to CSV to archive the differences between configurations for engineering reports
- Multi-configuration review — Compare three or more results simultaneously to understand how a parameter evolved across a development sequence
Opening the Compare View
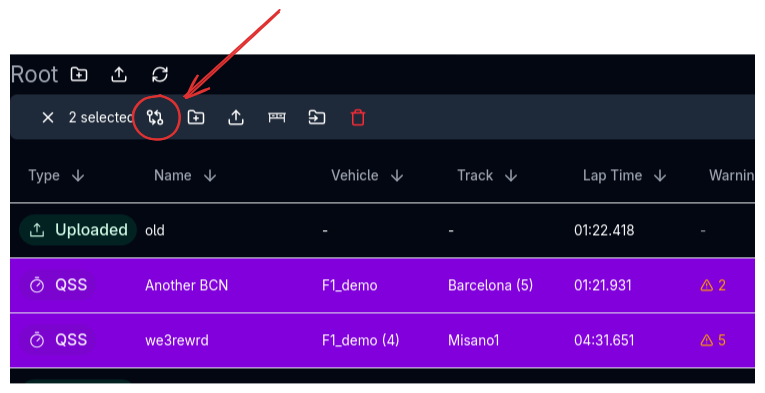
From the File Viewer, select one or more results and click the appropriate button in the command bar:
- One result selected — The button shows a view icon (eye) and opens the Vehicle Summary mode
- Two or more results selected — The button shows a compare icon and opens the Result Comparison mode
The view opens as a dialog overlay on top of the File Viewer.
Vehicle Summary Mode
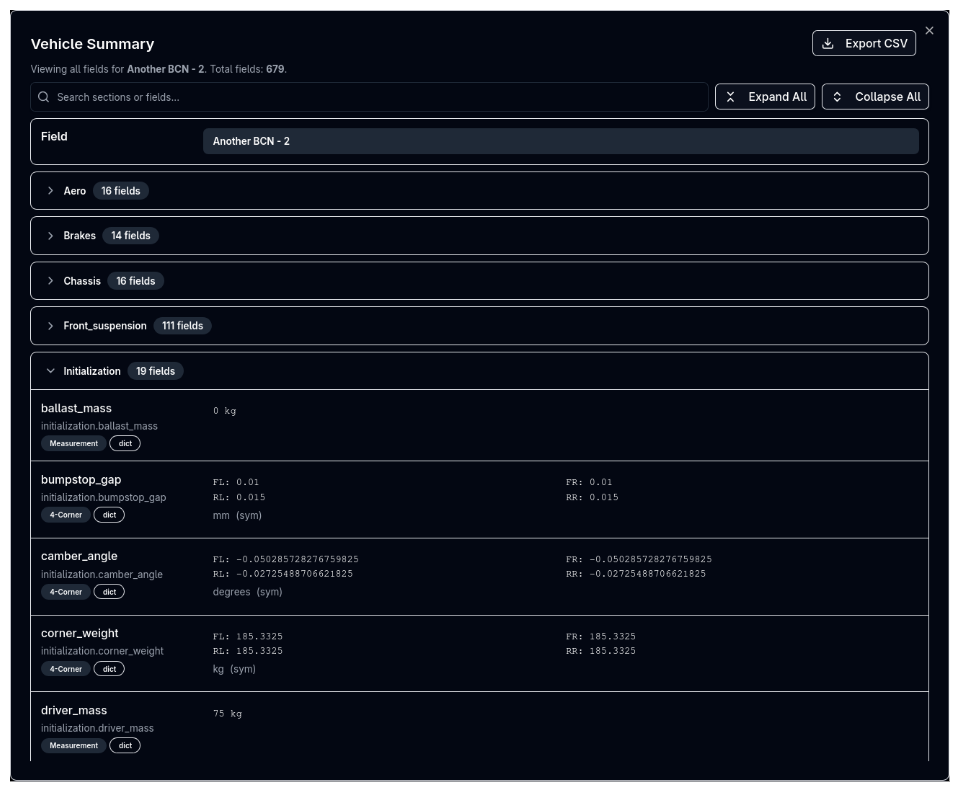
When a single result is selected, the view displays all fields from the vehicle configuration in a single column. Fields are grouped into collapsible sections by component type (e.g., Aerodynamics, Suspension, Powertrain, Brakes, Tyres). The dialog header shows the result name and total field count.
This mode is useful for reviewing a configuration without navigating to the setup editor, especially for results that were created by someone else or from a previous development phase.
Result Comparison Mode
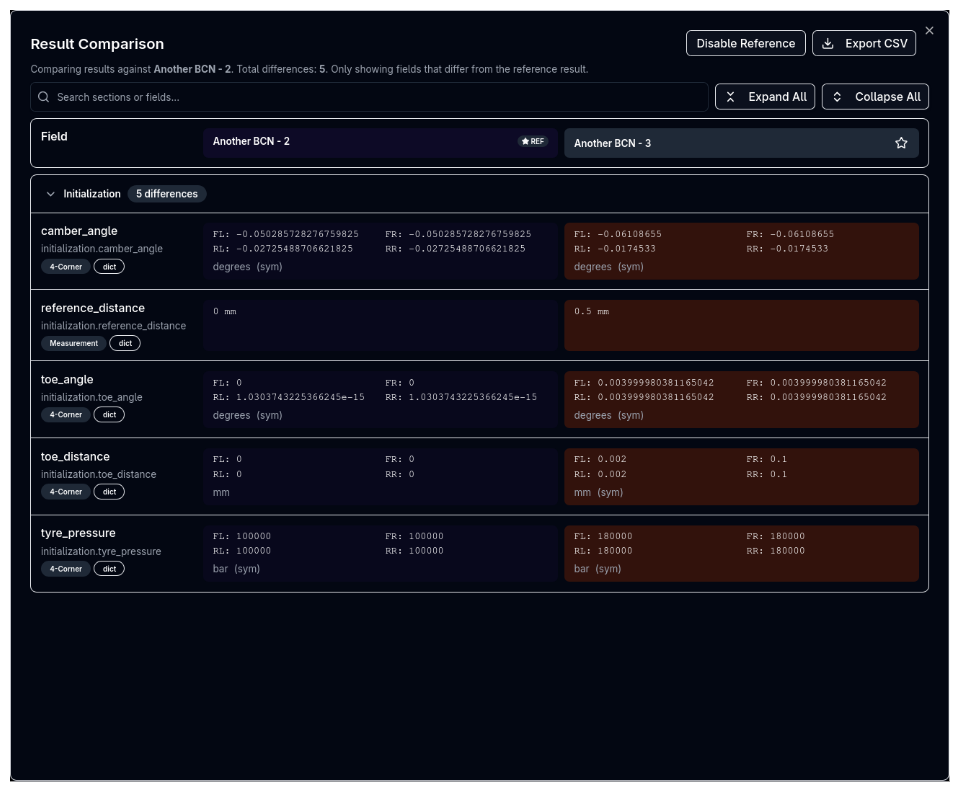
When two or more results are selected, the view shows only fields that differ between the configurations. Each result gets its own column, and values are displayed side by side for direct comparison. The dialog header shows the total number of differences found.
Reference Mode
By default, comparison mode enables reference mode, which designates one result as the baseline. The reference result is shown first (leftmost column) with a REF badge and a star icon next to its name. Its cells have a subtle highlight to distinguish them from other results.
Cells in other columns that differ from the reference are highlighted in orange, making it easy to scan for changes.
| Action | Effect |
|---|---|
| Click the star icon on any non-reference result | Sets that result as the new reference |
| Disable Reference button | Turns off reference mode — all results are shown equally, and all fields where any value differs are displayed |
| Enable Reference button | Re-enables reference mode with the first result as reference |
When reference mode is disabled, no cells are highlighted and the view simply lists all fields that have at least one differing value across the selected results.
Sections and Fields
Collapsible Sections
Fields are organised into collapsible sections grouped by vehicle component (e.g., Aerodynamics, Suspension Front, Suspension Rear, Powertrain, Brakes, Tyres). Each section header shows the section name and a count of fields (in summary mode) or differences (in comparison mode).
Click a section header to expand or collapse it. In Vehicle Summary mode, all sections start expanded. In comparison mode, sections start expanded by default.
Search
Use the search bar at the top of the dialog to filter fields by section name, field name, or field path. The search updates results in real time and shows the count of matching fields out of the total.
Expand and Collapse All
Two buttons in the toolbar let you Expand All or Collapse All sections at once, useful when navigating a large number of sections.
Data Types
Vehicle configurations contain a variety of structured data types. The compare view recognises each type and displays it with an appropriate format and a type badge for identification.
Simple Types
| Type | Badge | Display |
|---|---|---|
| Measurement | Measurement |
Value with unit (e.g., 2.5 mm) |
| Optional Measurement | Optional |
Value with unit, or "Disabled" if the field is turned off |
| Primitive | — | Plain number, string, or boolean |
Structured Types
| Type | Badge | Display |
|---|---|---|
| 4-Corner | 4-Corner |
Grid showing FL, FR, RL, RR values with unit (e.g., spring rates, damper settings) |
| 2-Axis | 2-Axis |
Front and rear values with unit |
| 3D Coordinate | 3D |
X, Y, Z values with unit and optional enabled/disabled state |
| List | List |
Array of values — shown inline if 5 or fewer, otherwise summarised as count |
| 2D Array | 2D Array |
Matrix of values shown as dimensions (e.g., 2D Array (5×3)) |
Complex Types (Expandable)
Some data types contain too much data to display inline. These show a compact summary by default with an expand button to reveal the full data.
| Type | Badge | Compact Summary | Expanded View |
|---|---|---|---|
| 1D Map | 1D Map |
Point count and axis units (e.g., 1D Map (12 points) rpm → Nm) |
Two-column table of X and Y values |
| 2D Map | 2D Map |
Grid dimensions and axis units (e.g., 2D Map (8×6) rpm, deg → Nm) |
Full data grid |
| Pickup Points | Pickup Points |
Point count and unit | Table with point names and X, Y, Z coordinates |
| Aero Offsets | Aero Offsets |
Offset count (e.g., 3 offsets) — only changed offsets are shown; unchanged offsets are hidden automatically |
Per-offset details: name, angle, reference angle, map type, coefficient counts. Offsets are sorted alphabetically across all columns. |
| Switchable Field | Data type name | Summary based on current type (numeric value, map dimensions, list count, or expression) | Full field data |
Click the expand/collapse icon next to a field name to toggle between compact and expanded views. Expanded views are scrollable when the data is large.
CSV Export
Click the Export CSV button in the dialog header to download the comparison data as a CSV file. The export includes:
- Section name, field name, and field path for each row
- One column per result with formatted values
- Structured types are formatted as readable strings (e.g.,
FL: 2.5, FR: 2.5, RL: 3.0, RR: 3.0 N/mm)
The filename is generated from the result names (e.g., comparison_Baseline_vs_HighDF.csv).
Tips & Best Practices
Use Reference Mode for A/B Testing
When comparing a new configuration against a baseline, set the baseline as the reference. Orange-highlighted cells immediately draw your eye to what changed, and the reference column provides the "before" values.
Search for Specific Parameters
If you're looking for a specific parameter (e.g., "spring rate" or "ride height"), use the search bar rather than scrolling through all sections. The search matches section names, field names, and field paths.
Export Before Debriefs
Export the comparison to CSV before a debrief meeting. The CSV can be shared with team members who don't have access to ARD, or imported into a spreadsheet for further analysis.
Compare More Than Two
The compare view supports more than two results. When investigating a development trend, load three or more results in chronological order to see how parameters evolved across iterations.
Recreate a Setup from Results
If the comparison reveals that a previous configuration was better, use the Recreate Setup action in the File Viewer to restore that configuration from the result.
Related Topics
- File Viewer — Select results and open the compare view
- Metrics — Compare performance metrics across results
- Trace View — Overlay simulation traces for visual comparison
- Parallel Coordinate Plots — Explore multi-dimensional sweep differences