Metrics
The Metrics page provides a configurable dashboard for viewing, comparing, and exploring simulation results. It combines scatter plots and data tables in a flexible grid layout, giving you both visual and numerical tools to analyse performance across multiple simulations.
Overview
Every simulation in ARD produces a set of summary metrics — lap time, sector times, maximum speeds, g-forces, energy consumption, and more. The Metrics page lets you view these metrics for all simulations currently loaded on the simulation desk, whether they come from individual runs or a Parameter Sweep.
The page is built around a configurable grid layout where you choose how many scatter plots and tables to display, what data each one shows, and how they are arranged. Layouts can be saved and reloaded, making it easy to switch between different analysis workflows.
How Racing Teams Use It
- Quick lap time comparison — Load multiple simulation results and immediately see which configuration is fastest in the metrics table
- Identifying correlations — Use scatter plots to check whether higher top speed correlates with faster lap times, or whether minimum corner speed matters more
- Sweep analysis — After a parameter sweep, load all permutations and use colour-coded scatter plots to see how a swept parameter maps to performance
- Setup comparison — Compare different aero packages, spring sets, or tyre compounds side by side with colour-coded data points
- Report preparation — Configure a layout with the key plots and tables needed for a debrief, save it, and reuse it after each session
Grid Layout
The Metrics page uses a configurable grid of cells, where each cell is either a scatter plot or a data table. You control the number of rows and columns, and each cell can span multiple rows or columns for flexible arrangements.
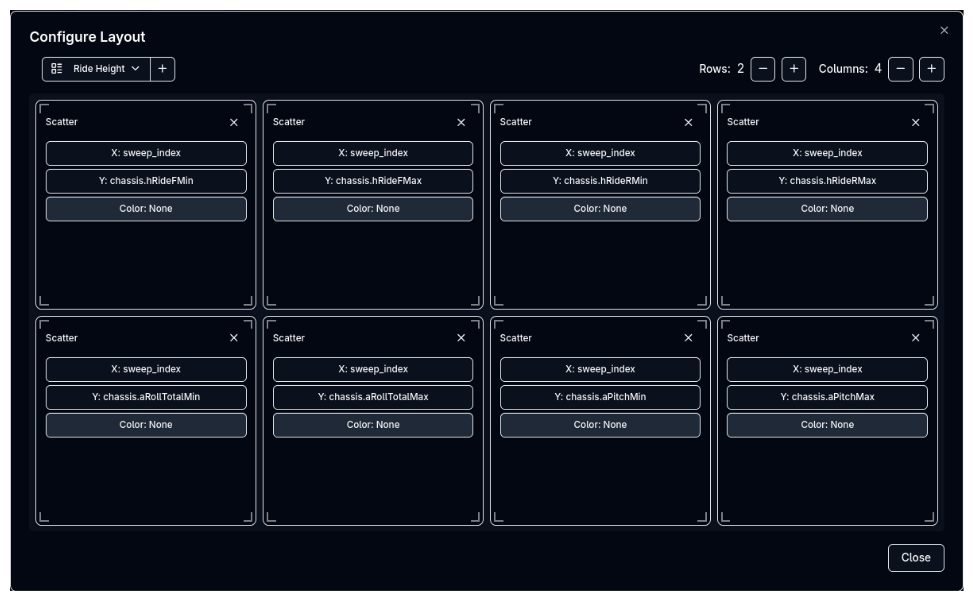
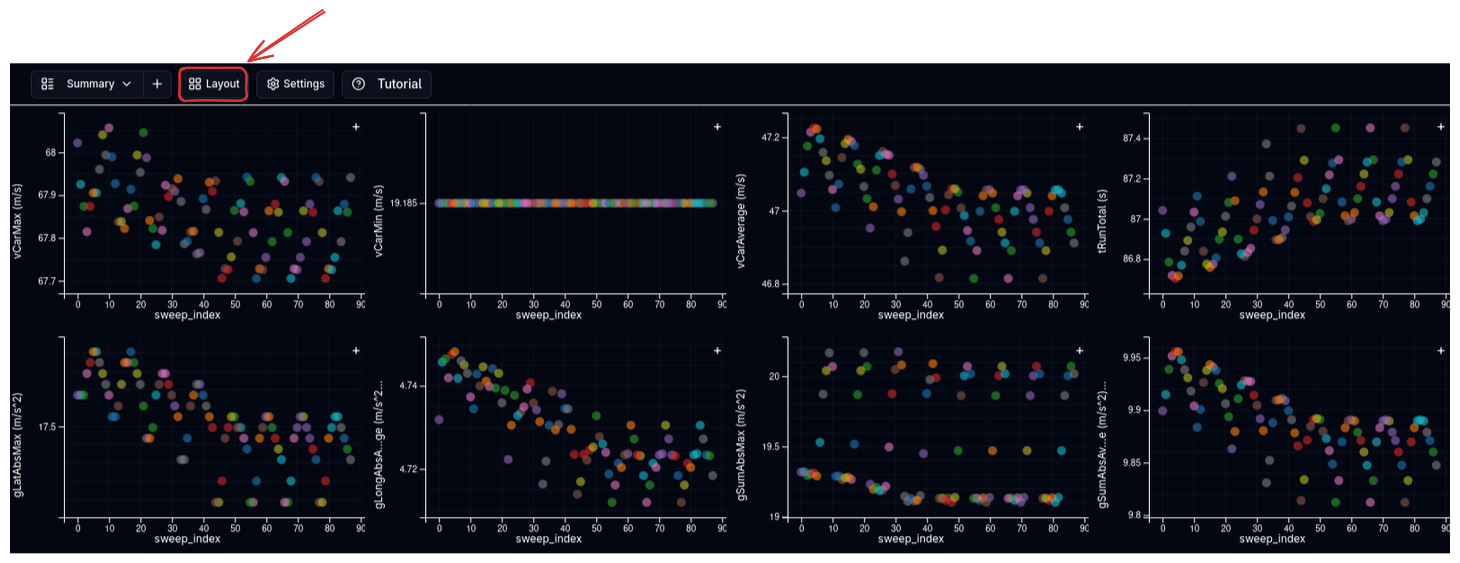
Configuring the Layout
Click the Layout Configuration button (grid icon) to open the layout editor. From here you can:
- Set the number of rows and columns in the grid
- Click on individual cells to assign their type — Scatter Plot or Table
- Resize cells by dragging the corner handles to span multiple rows or columns
- Configure channel assignments for scatter plot cells (X axis, Y axis, and colour channel)
Changes are previewed in the dialog before you apply them. The layout updates immediately when you confirm.
Cell Types
| Cell Type | Description |
|---|---|
| Scatter Plot | Plots each simulation as a point with configurable X, Y, and colour axes |
| Table | Shows all simulation metrics in a sortable, colour-coded table |
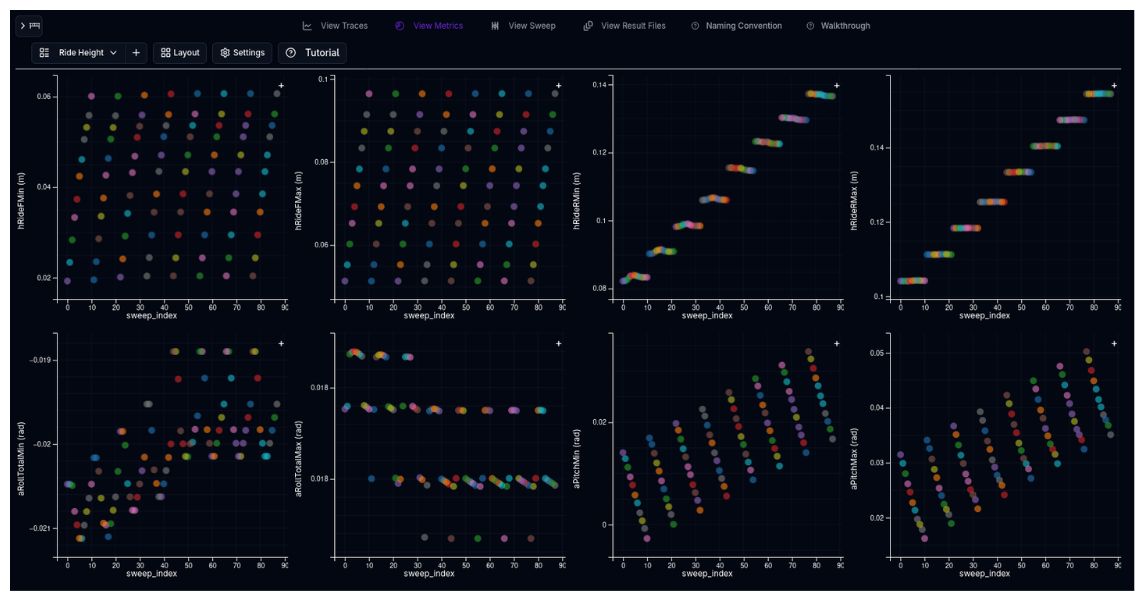
Scatter Plots
Scatter plots display each simulation result as a single point, positioned by two chosen metrics. An optional third metric can control the point colour, creating a three-dimensional view of the data.
Configuring Axes
Each scatter plot has three configurable channels:
| Channel | Description |
|---|---|
| X Axis | The metric shown on the horizontal axis (e.g., top speed) |
| Y Axis | The metric shown on the vertical axis (e.g., lap time) |
| Colour | An optional metric that maps to point colour (e.g., minimum corner speed). If not set, points use their default simulation colour |
Click on the axis label or the settings icon on a scatter plot to open the channel selector and choose from all available metrics. Each channel shows the metric name and its unit.
Interaction
- Hover over a point to see a tooltip with the simulation name, all swept parameter values, and the plotted metric values
- Click a point to select it — the selection is synchronised across all scatter plots and tables on the page
- Points from the same sweep share a colour scheme, making it easy to distinguish different sweep families
Available Channels
Scatter plots can display any metric produced by the simulation, including:
- Lap time and sector times
- Maximum and minimum speeds
- Longitudinal and lateral g-forces
- Energy consumption and fuel usage
- Sweep index (simulation number within the sweep)
The exact list of available channels depends on the simulation type (Lap Time, Straight Line, or Cornering).
Metrics Table
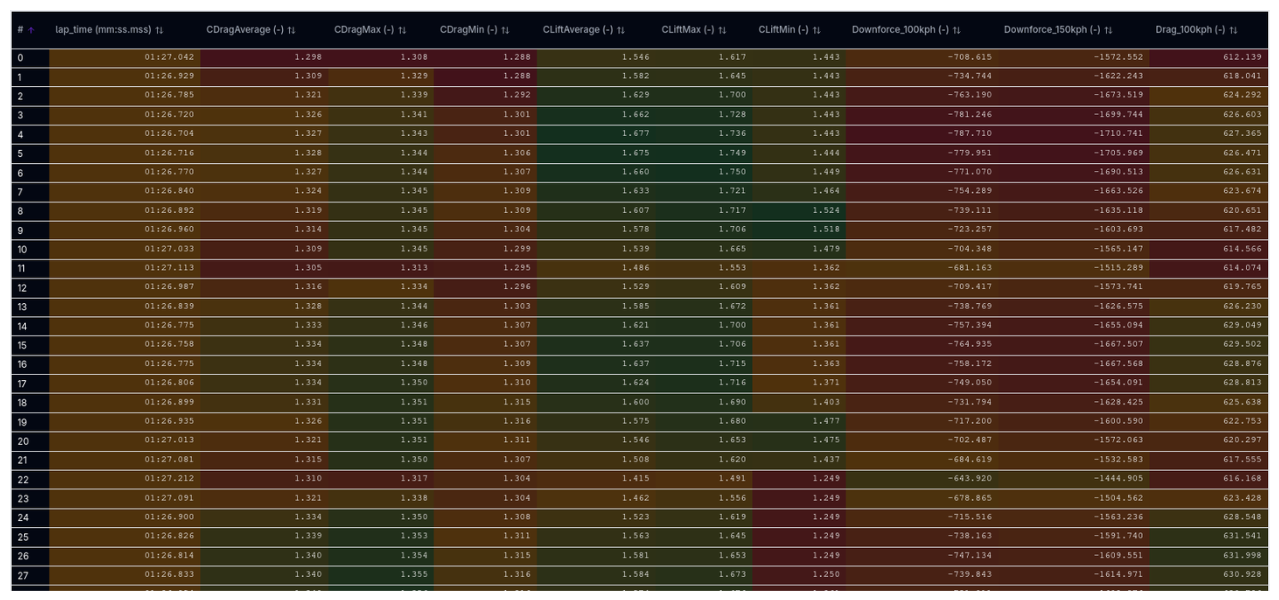
The metrics table shows all loaded simulation results in a tabular format with one row per simulation and one column per metric.
Sorting
Click any column header to sort the table by that metric. Click again to reverse the sort order. This makes it easy to rank configurations by any metric — for example, sort by lap time to see the fastest at the top.
Colour Contours
Numeric columns are colour-coded using a gradient that maps from the minimum to the maximum value in that column. This provides an instant visual indication of where each result falls in the range:
- Colours interpolate smoothly between three reference points (best, middle, worst)
- The colour scheme is configurable in the settings
This makes it easy to spot patterns — for example, you might notice that all the green (fast) lap time rows also have green (high) minimum corner speeds, revealing a correlation.
Column Visibility
Hover over the table header area to reveal the column selector button. Click it to choose which metrics are visible in the table. This works the same way as the Parallel Coordinates column selector, with columns grouped into Input and Outcome categories.
Simulation Naming
When all loaded results come from the same sweep, the table simplifies the name column to show only the simulation number within the sweep (e.g., "#1", "#2", "#3") rather than the full sweep name. This keeps the table compact when comparing many permutations.
Row Hover
Hover over any row to see a tooltip with the full simulation name, notes, and all metric values. The hover is synchronised with scatter plots — hovering a row highlights the corresponding point on all scatter plots, and vice versa.
Layout Management
The Metrics page supports multiple saved layouts, allowing you to switch between different dashboard configurations without reconfiguring from scratch.
Saving and Loading Layouts
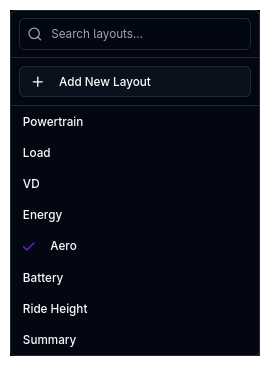
Use the layout selector in the toolbar to:
- Switch between saved layouts using the dropdown
- Create a new layout with the add button
- Rename an existing layout
- Delete layouts you no longer need
- Search for layouts by name when you have many saved
Layouts persist across sessions, so your preferred analysis dashboards are always available.
Create Purpose-Built Layouts
Save different layouts for different analysis tasks — for example, one layout with a large scatter plot for sweep exploration, another with multiple tables for detailed metric comparison, and a third with side-by-side scatter plots for correlating different metrics.
Settings
Click the Settings button (gear icon) to configure display options for the Metrics page, including the colour scheme used for table contours and scatter plot colour channels.
Tips & Best Practices
Scatter Plots for Patterns, Tables for Precision
Use scatter plots to spot trends and outliers visually, then refer to the table for exact numbers. The hover synchronisation between them makes this workflow seamless.
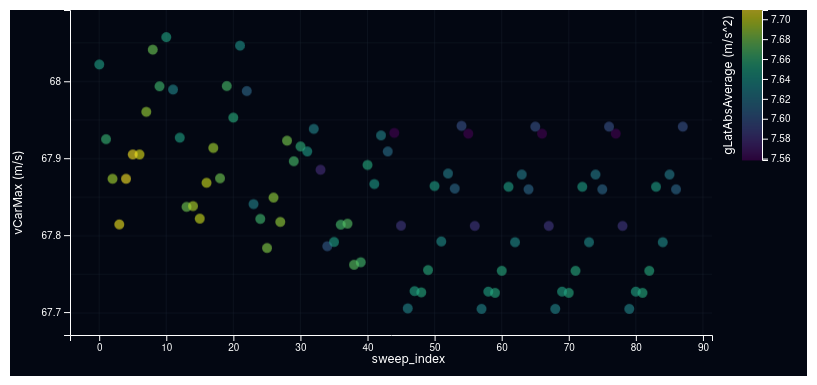
Use the Colour Channel
The scatter plot colour channel turns a 2D plot into a 3D visualisation. For example, plot lap time (Y) vs. top speed (X) and colour by minimum corner speed to see how all three metrics relate.
Start Simple
Begin with a single scatter plot and a single table (2x1 grid). Add more cells only when you have a specific question that requires a different view. Overly complex layouts can be harder to interpret than simple ones.
Sweep Index as X Axis
When analysing sweep results, try using sweep index (simulation number) as the X axis. This plots results in the order they were generated, which often corresponds to the parameter sweep order and can reveal trends across the sweep range.
Metrics Only
The Metrics page shows summary metrics only — it does not display per-point trace data (speed vs. distance, g-force vs. time, etc.). For detailed trace analysis, use the Trace View. See the Sweep documentation for more on the difference between metrics and trace data.
Related Topics
- Parallel Coordinate Plots — Visualise multi-dimensional sweep results
- Parameter Sweep — Run sweeps to generate comparative metrics
- Trace View — Analyse detailed per-point simulation data
- Vehicle Compare — Compare vehicle configurations side by side