Results Upload (Telemetry)
The Results Upload feature lets you import real-world telemetry data from your data logging system into ARD. Once uploaded, telemetry can be overlaid with simulation results in the Trace View for correlation, validation, and driver analysis.
Overview
Telemetry upload is a guided, multi-step process that takes you from a raw data file to a fully mapped result in ARD. The system handles:
- File parsing — Reads CSV, Excel, and other tabular formats, including multi-sheet workbooks
- Channel detection — Automatically identifies common channels (speed, distance, g-force, etc.) from column names
- Unit mapping — Lets you specify the unit for each column so ARD can convert to its internal SI representation
- Postprocessing — Options for lap selection, distance zeroing, and data cleaning
- Track creation — Optionally generates a track layout from the uploaded telemetry
How Racing Teams Use It
- Simulation correlation — Upload logged data from a test day and overlay it with simulation results to validate the vehicle model
- Driver analysis — Import telemetry to view speed traces, g-g diagrams, and ride height data alongside simulation predictions
- Track creation — Generate a track layout from GPS or curvature data in the telemetry, avoiding manual track entry
- Baseline comparison — Upload a reference lap and compare it against simulated setups to quantify improvements
- Data archiving — Store telemetry alongside simulation results in the same folder structure for easy retrieval
Supported File Formats
| Format | Extensions | Notes |
|---|---|---|
| CSV | .csv |
Comma-separated values |
| TSV | .tsv, .txt |
Tab-separated values |
| Excel | .xls, .xlsx |
Multi-sheet support — select which sheet to use |
| PRN | .prn |
Fixed-width or space-separated |
The maximum file size is 50 MB. Large files are uploaded in chunks with a progress indicator.
Upload Workflow
The upload process is divided into steps, each handled in a dialog that guides you through the process. You can navigate back to previous steps at any time using the Back button.
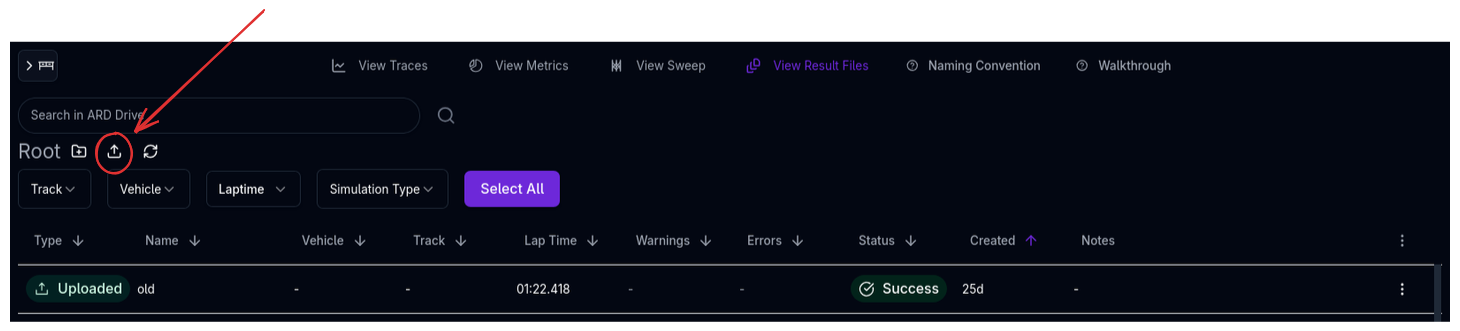
Step 1: File Selection
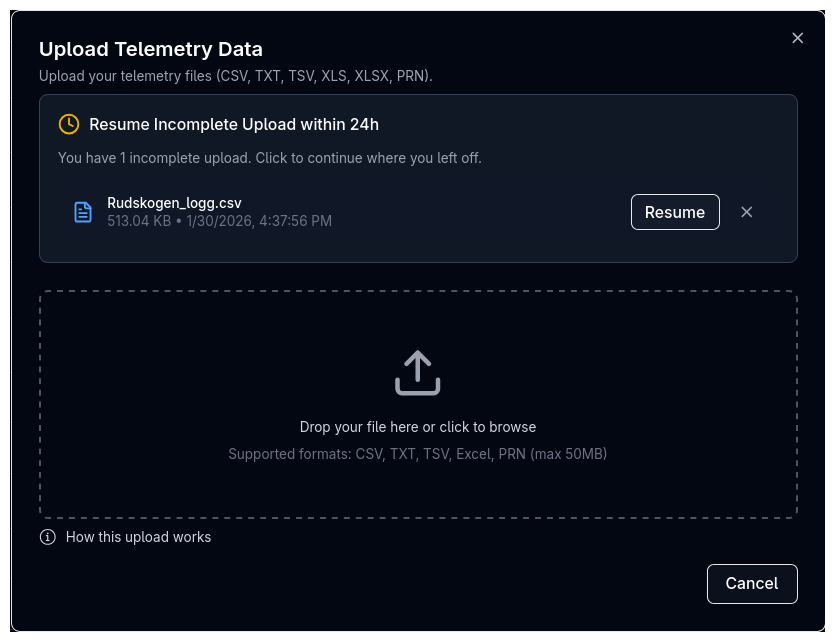
Drag and drop a file onto the upload area, or click to open a file browser. The dialog shows the file name, size, and detected format once selected.
Resuming Incomplete Uploads
If you have incomplete upload sessions from the last 24 hours, they appear at the top of the file selection step. Click Resume to continue where you left off — your channel mappings and unit selections are preserved. Click Discard to delete the session permanently.
Step 2: Sheet Selection (Excel Only)
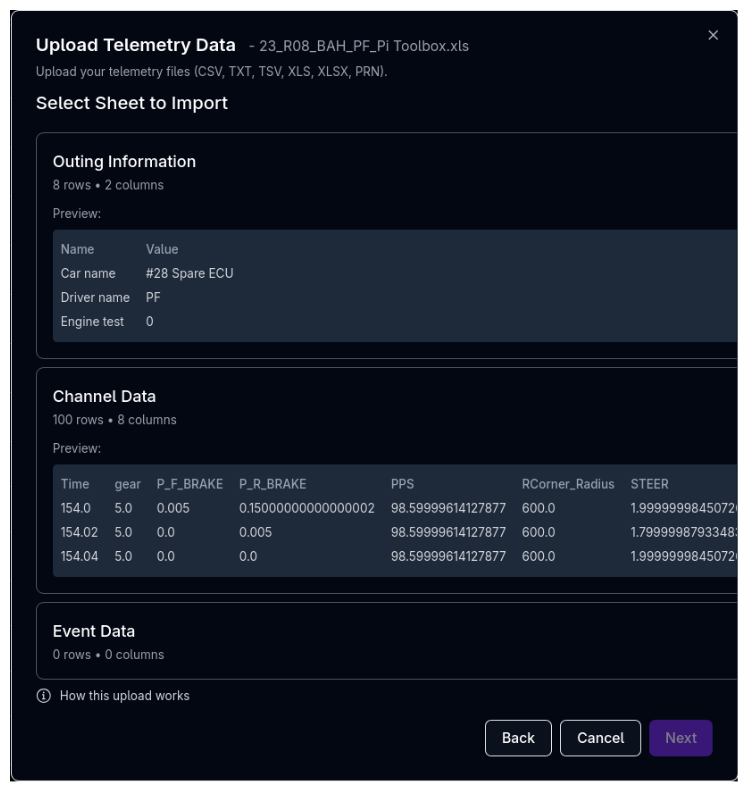
If your file is an Excel workbook with multiple sheets, this step lets you choose which sheet contains the telemetry data. For single-sheet files, this step is skipped automatically.
Step 3: Choose Starting Mappings
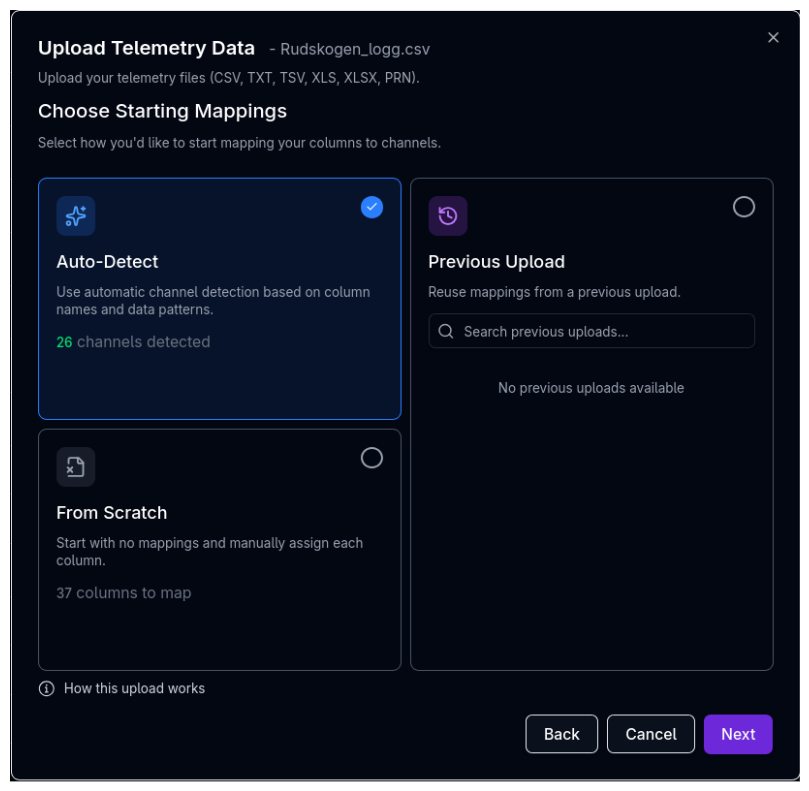
Before mapping columns, choose how to initialise the mappings:
| Option | Description |
|---|---|
| Auto-Detect | Uses automatic channel detection based on column names and data patterns. Shows how many channels were detected (e.g., "12 channels detected") |
| From Scratch | Starts with no mappings — you assign every column manually. Shows the total number of columns to map |
| Previous Upload | Reuses mappings from a previous upload session. The system shows which previous uploads have matching columns and how many match (e.g., "8/12"). Search and filter previous uploads by name |
Use Auto-Detect First
Auto-detect works well for files with standard channel names (e.g., "Speed", "Distance", "gLat"). Start with auto-detect and manually correct any misidentified channels in the next step, rather than mapping everything from scratch.
Step 4: Column Mapping
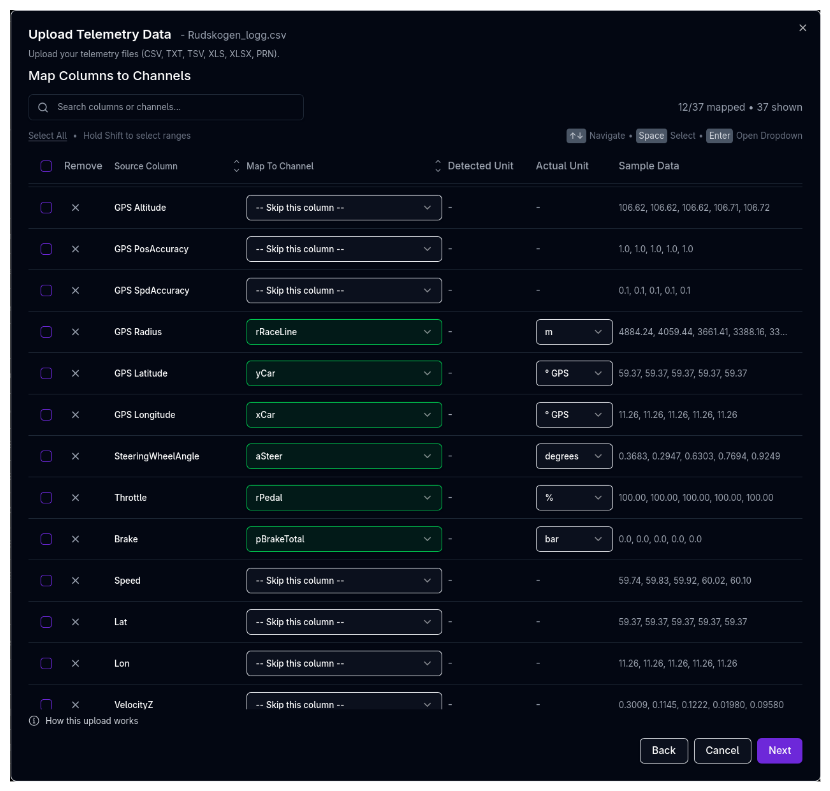
The column mapping step is where you assign each column in your file to an ARD channel and specify its unit. This is the most important step — correct mappings ensure the data displays and converts properly.
The Mapping Table
Each row represents one column from your file:
| Column | Description |
|---|---|
| Source | The original column header from your file |
| Channel | The ARD channel to map this column to (e.g., vCar for speed, sRun for distance) |
| Unit | The unit the source data is in (e.g., km/h, m, g). ARD converts to SI units internally |
| Sample | A preview of the first few values to help identify the data |
Mapping a Column
Click the Channel dropdown for a row to open the channel selector. Search for the desired channel by name. Channels are grouped by category for easier navigation.
To skip a column (exclude it from the upload), leave it unmapped or set it to skip.
Unit Selection
After mapping a channel, set the correct unit for the source data. If the auto-detected unit does not match your data, click the unit dropdown to change it. A warning appears if the detected unit differs from your selection.
Keyboard Navigation
The mapping table supports keyboard shortcuts for efficient mapping:
| Key | Action |
|---|---|
| Arrow Up/Down | Move focus between rows |
| Enter | Open the channel dropdown for the focused row |
| Space | Toggle row selection |
| Shift + Click | Select a range of rows between the last selected and the clicked row |
Bulk Operations
- Search — Filter rows by source column name or mapped channel name
- Sort — Click column headers to sort by source name or channel assignment
- Select All — Select all visible rows for bulk operations
- Remove Selected — Clear the mapping for all selected rows at once
Warnings
The mapping step alerts you to potential issues:
- No Standard X-Axis — If no distance (
sRun), time (tRun), or speed (vCar) channel is mapped, a warning appears. These channels are needed to visualise the data in the Trace View - Duplicate Mappings — If two columns are mapped to the same channel, a red warning appears with clickable links to navigate to the conflicting rows. Duplicates must be resolved before proceeding
Step 5: Finalize
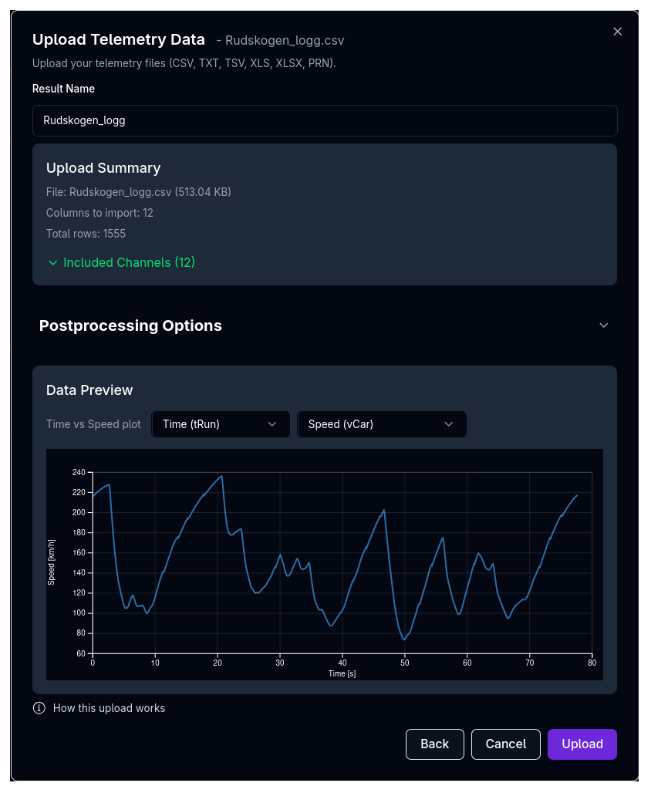
The finalize step shows a summary of your upload and lets you configure postprocessing options before creating the result.
Result Name
Enter a name for the uploaded result. This is how it will appear in the File Viewer.
Upload Summary
A summary card shows:
- File name and size
- Number of mapped channels
- Total rows of data
- List of included channels (expandable)
Postprocessing Options
Configure how the data should be processed before saving:
- Lap selection — If the data contains multiple laps, choose which laps to include
- Distance zeroing — Start distance values at zero (recommended for clean overlay with simulation data)
Data Preview
A chart previews the uploaded data with configurable axes:
- X Axis — Choose between Distance, Time, or Speed
- Y Axis — Choose any mapped channel to preview
- The preview updates as you change postprocessing options, so you can verify the data looks correct before uploading
Non-Sequential Distance
If the data contains rows where distance values go backwards (e.g., from a logger reset), a warning shows how many rows will be discarded. This ensures clean, monotonically increasing distance data.
Step 6: Complete
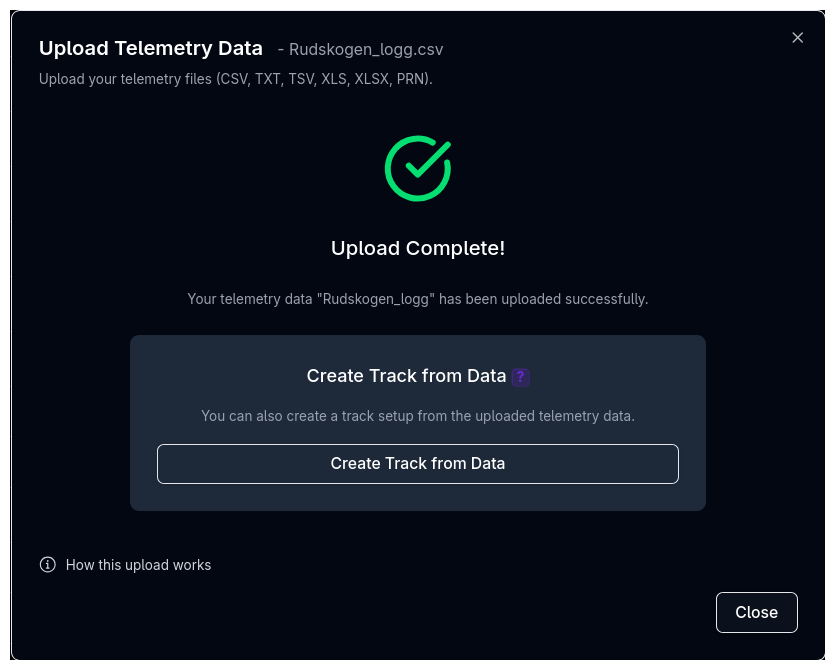
Once the upload finishes, a confirmation screen shows the result name and offers the option to create a track from the telemetry data.
Track Creation
If the uploaded data contains sufficient spatial information, you can generate a track layout directly from the telemetry. The button is enabled when the data includes one of the following combinations:
- Distance and curvature (
sRunandcRaceline) - X and Y position (
xCarandyCar, in metres or GPS degrees) - Speed, distance, and lateral acceleration (
vCar,sRun, andgLat)
If the required channels are not mapped, the button is disabled and a tooltip explains which channel combinations are needed.
Create a Track While You're Here
If you plan to simulate on this circuit and don't already have a track setup, creating one from telemetry is the fastest way. The generated track captures the actual circuit layout including elevation and curvature, which is more accurate than manual entry.
Tips & Best Practices
Consistent Naming
Use a consistent naming convention for uploaded results — for example, include the driver, session, and date (e.g., "Driver A - FP1 - 2024-03-15"). This makes results easy to find later in the File Viewer.
Map the X-Axis Channel
Always map at least one x-axis channel (sRun for distance, tRun for time, or vCar for speed). Without one of these, the data cannot be plotted in the Trace View.
Check Units Carefully
The most common upload issue is incorrect units. If speed is in km/h but mapped as m/s, all values will be off by a factor of 3.6. Use the sample data column to sanity-check values against expected ranges.
Reuse Previous Mappings
If you regularly upload files from the same logging system, use the Previous Upload mapping source. This saves significant time by reusing the channel and unit assignments from a prior upload of the same format.
Resume If Interrupted
If you close the browser or navigate away during an upload, your session is preserved for 24 hours. Return to the upload dialog to resume where you left off.
Use the alignment tool
If you are comparing your telemtry to simulated data and the start and end points seem misaligned, use our auto alignment tool.
Related Topics
- File Viewer — Browse and manage uploaded results
- Trace View — Overlay telemetry with simulation data
- Track Configuration — Manage tracks created from telemetry