Calculations (Vehicle Properties)
The Calculations page computes static vehicle properties from your current setup — suspension rates, natural frequencies, mass breakdowns, kinematic characteristics, and shift points — without running a full simulation. Results are displayed in a grid of sortable property cards, and multiple calculations can be compared side by side.
Overview
Unlike lap time or sweep simulations that model the car around a circuit, calculations derive static properties directly from the vehicle setup at rest. They run instantly and are useful for sanity-checking a configuration before committing to a full simulation.
Each calculation is saved as a named result that you can load back later for comparison.
How Racing Teams Use It
- Setup validation — Verify that ride rates, roll rates, and natural frequencies fall within expected ranges before running a lap simulation
- Configuration comparison — Run calculations on two setups and compare them side by side to see the effect of a spring or anti-roll bar change
- Frequency targeting — Check sprung, ride, and wheel hop frequencies to ensure they meet the team's design targets
- Shift point review — Verify optimal gear shift points (speed and RPM) computed from the powertrain model
- Quick iteration — Make a setup change, run a calculation, and immediately see how rates and frequencies respond — without waiting for a full simulation
Running a Calculation
- Click Add Calculation
- Enter a name for the calculation
- Click Run
The calculation runs against your currently loaded vehicle setup and appears in the property cards below. Any vehicle warnings are shown next to the page title.
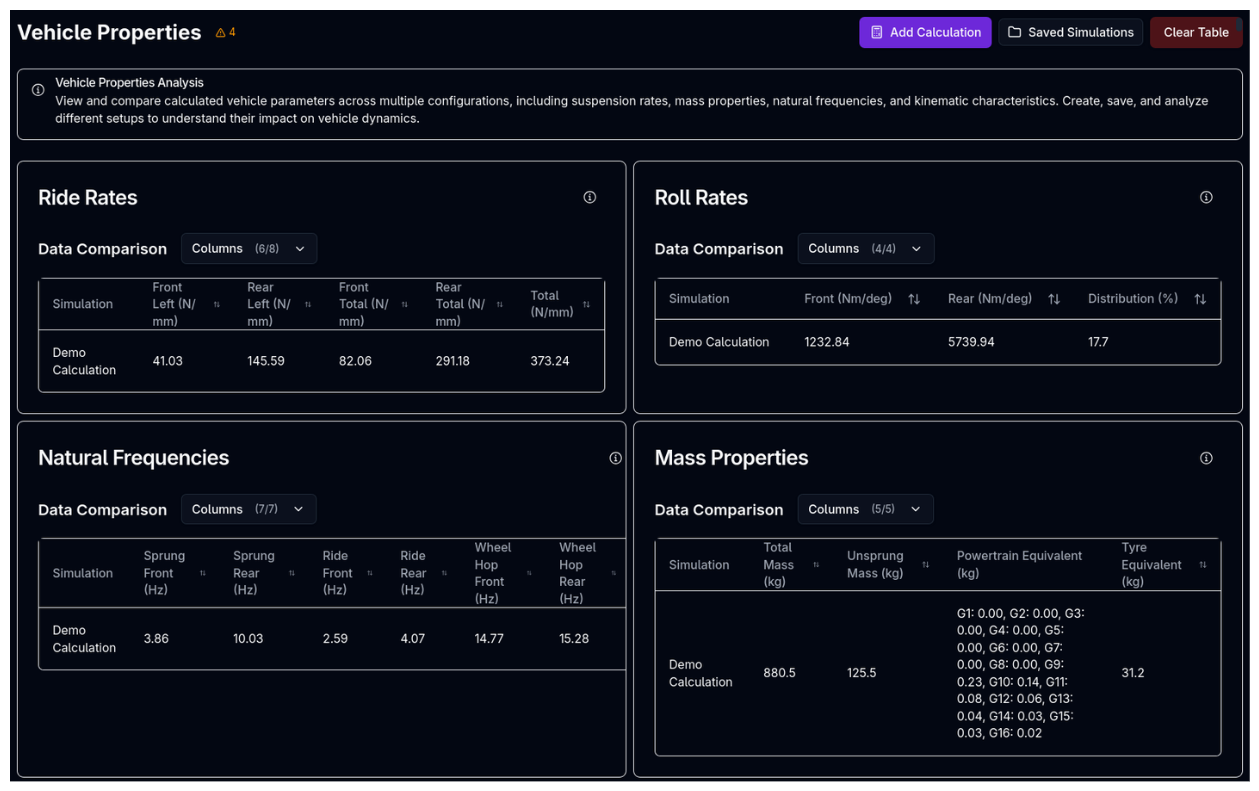
Property Cards
Results are displayed in a grid of property cards. Each card shows a sortable table where each row is a saved calculation, making it easy to compare values across configurations.
Ride Rates
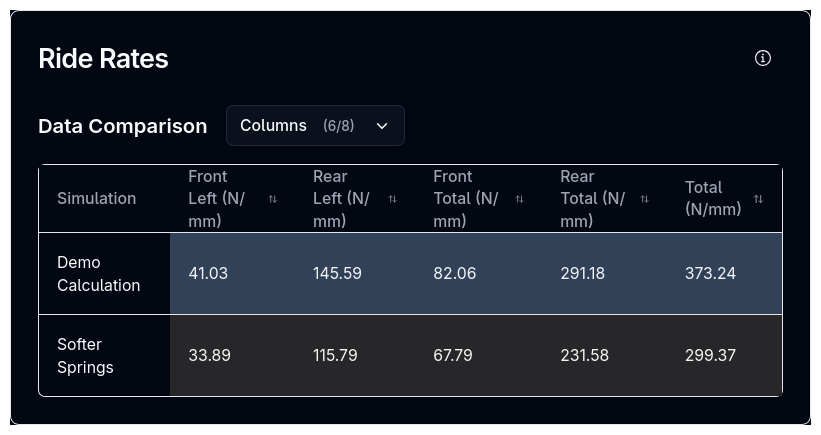
Combined spring and tyre vertical rates at each corner, plus front, rear, and total sums.
| Column | Unit | Description |
|---|---|---|
| FL, FR, RL, RR | N/mm | Ride rate at each corner (series combination of wheel rate and tyre rate) |
| Front Total | N/mm | Sum of FL and FR ride rates |
| Rear Total | N/mm | Sum of RL and RR ride rates |
| Total | N/mm | Sum of all four corners |
Roll Rates
Front and rear roll stiffness with the roll stiffness distribution percentage.
| Column | Unit | Description |
|---|---|---|
| Front | Nm/deg | Front axle roll stiffness (springs + anti-roll bar) |
| Rear | Nm/deg | Rear axle roll stiffness (springs + anti-roll bar) |
| Distribution | % | Front roll stiffness as a percentage of total |
Natural Frequencies
Three frequency categories computed from the vehicle's mass and rate properties.
| Column | Unit | Description |
|---|---|---|
| Sprung Front / Rear | Hz | Sprung mass natural frequency (using axle vertical rates and sprung mass) |
| Ride Front / Rear | Hz | Ride frequency (using combined ride rates and sprung mass) |
| Wheel Hop Front / Rear | Hz | Unsprung mass natural frequency (using tyre rates and unsprung mass) |
Mass Properties
| Column | Unit | Description |
|---|---|---|
| Total Mass | kg | Total vehicle mass |
| Unsprung Mass | kg | Total unsprung mass (wheels, uprights, brakes) |
| Powertrain Equivalent | kg | Equivalent translational mass per gear from rotational inertia |
| Tyre Equivalent | kg | Equivalent translational mass from tyre rotational inertia |
Axle Rates
| Column | Unit | Description |
|---|---|---|
| Front | N/mm | Front axle rate (combined left + right wheel rates) |
| Rear | N/mm | Rear axle rate (combined left + right wheel rates) |
Suspension Kinematics
Anti-geometry percentages computed at static ride height.
| Column | Unit | Description |
|---|---|---|
| Anti-Dive | % | Percentage of front load transfer resisted by suspension geometry under braking |
| Front Anti-Lift | % | Percentage of front lift resisted by geometry under acceleration |
| Rear Anti-Lift | % | Percentage of rear lift resisted by geometry under braking |
| Anti-Squat | % | Percentage of rear squat resisted by geometry under acceleration |
Powertrain
| Column | Description |
|---|---|
| Shift Points Speed | Optimal upshift speeds per gear transition (km/h) |
| Shift Points RPM | Optimal upshift engine speeds per gear transition (RPM) |
Comparing Calculations
To compare multiple configurations:
- Run a calculation on your first setup
- Modify the vehicle setup
- Run another calculation with a different name
- Both appear as rows in each property card, side by side
Use the simulation viewer button to toggle which saved calculations are visible in the tables. Click Clear Table to remove all calculations from the current view.
Click any column header to sort the table by that metric.
Tips & Best Practices
Name Calculations Descriptively
Use names that describe the setup change (e.g., "Baseline", "Stiffer Front ARB", "Soft Springs"). This makes comparison rows meaningful at a glance.
Check Frequencies First
Natural frequencies are one of the fastest ways to validate a setup. Front ride frequency should typically be lower than rear (for stability), and wheel hop frequencies should be well separated from ride frequencies.
Use Before Full Simulations
Run a quick calculation before committing to a lap time simulation. If ride rates or roll distribution are outside your target window, fix them first rather than wasting simulation time.
Related Topics
- Lap Time Simulation — Full lap simulation using the same vehicle setup
- Suspension Setup — Configure springs, dampers, and anti-roll bars that feed into rate calculations
- Tyres Setup — Tyre rates that combine with spring rates to produce ride rates